How to Define a Minimal Viable Product (MVP) for Data Processing and Analytics
1. Identify the Core Problem Before anything else, clarify the specific problem your product aims to solve. The MVP should focus solely on addressing this core issue.
For our example, the core problem is that businesses have large datasets but lack the infrastructure or expertise to process, analyze, and extract actionable insights.
2. Determine Your Target Audience Next, identify the primary users who will benefit from your solution. The MVP should be designed with this audience in mind.
In this case, our target audience consists of companies that need quick insights from their data but don’t have the technical resources to do it themselves.
3. List the Core Features The MVP should only include essential features that solve the core problem. Avoid overcomplicating it with additional, non-essential functionality.
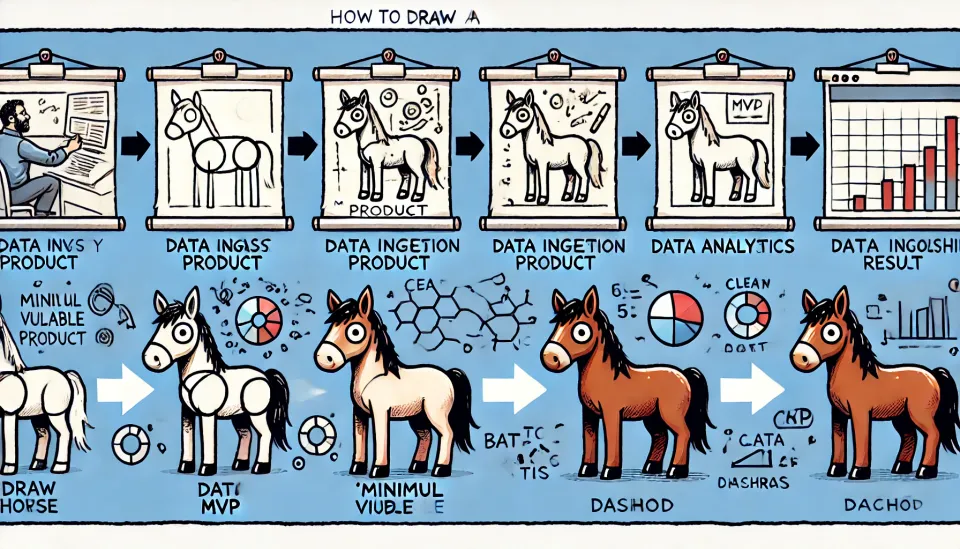
For the data processing and analytics platform, the core features are:
- Data ingestion: Allow businesses to upload raw data (e.g., a CSV file).
- Basic data processing: Perform minimal cleaning and transformation, such as removing outliers and normalizing data.
- Simple analytics: Run basic algorithms (e.g., trend analysis or anomaly detection) on the processed data.
- Context enrichment: Add relevant context, like time stamps or geographic regions, to the results.
- Basic dashboard: Display the results in a simple, easy-to-read format (charts, graphs, tables).
4. Create Simple User Flows Map out the main paths your users will take when interacting with the product. These flows should be as straightforward as possible, focusing only on the primary functionality.
For our platform, the flow might look like this:
- Ingest flow: The user uploads a dataset through the web interface.
- Processing flow: The system cleans and transforms the data.
- Analytics flow: Basic algorithms run on the processed data to extract insights.
- Context enrichment flow: The results are enhanced with additional metadata or context.
- Presentation flow: The user views the results in a simple dashboard.
5. Build Prototypes or Mockups Before diving into development, create a basic prototype or mockup of the product. This helps to visualize the user experience and get early feedback.
For our example, you could create a prototype that allows users to upload data, run simple analytics, and view the results on a dashboard with basic visualizations (e.g., line graphs or bar charts).
6. Define Success Criteria How will you know if the MVP is successful? Set specific goals and metrics to measure the product’s impact. For instance, success for the data processing platform could be defined as:
- The user is able to upload a dataset and receive insights within 24 hours.
- Feedback shows that the insights are valuable and the dashboard is easy to use.
7. Gather Feedback and Iterate Once the MVP is live, gather feedback from early users. This will help you identify what works, what doesn’t, and what needs improvement. Use this feedback to refine the product and add new features.
An MVP Example: Data Processing and Analytics Platform
Let’s bring everything together with a practical example of how an MVP might look for a data processing and analytics platform.
The Core Problem:
Businesses need a quick, easy way to ingest, process, and analyze large datasets to gain insights, but they lack the resources or infrastructure to handle this in-house.
The Core Features of the MVP:
- Ingest Data: Users upload a raw dataset (e.g., a CSV file).
- Basic Data Processing: The system cleans the data by removing errors and normalizing it.
- Run Basic Analytics: The platform runs a simple trend analysis to identify patterns in the data.
- Enrich with Context: The processed data is enhanced with time stamps or geographic information.
- Present the Results: The results are displayed in a simple dashboard using charts and graphs.
A Basic User Flow:
- A company uploads sales data through the web interface.
- The system processes the data by removing errors and outliers.
- A basic trend analysis is run to identify sales patterns over time.
- The results are enriched with time stamps and geographic regions.
- The company receives a report via a dashboard, showing sales trends and anomalies.
Success Criteria:
- Data upload to insight within 24 hours.
- Positive user feedback on the simplicity of the dashboard.
- Early adoption by at least 10 businesses, with insights from their datasets.
Iteration Based on Feedback:
Once users start using the MVP, feedback might indicate they want more advanced analytics or additional customization options in the dashboard. Future versions of the platform could then focus on adding these features.